

TL;DR

Get business pricing on tech for your team
- Business-only prices and quantity discounts
- Tax-exempt purchasing
- Multiple users, one account, clear invoices
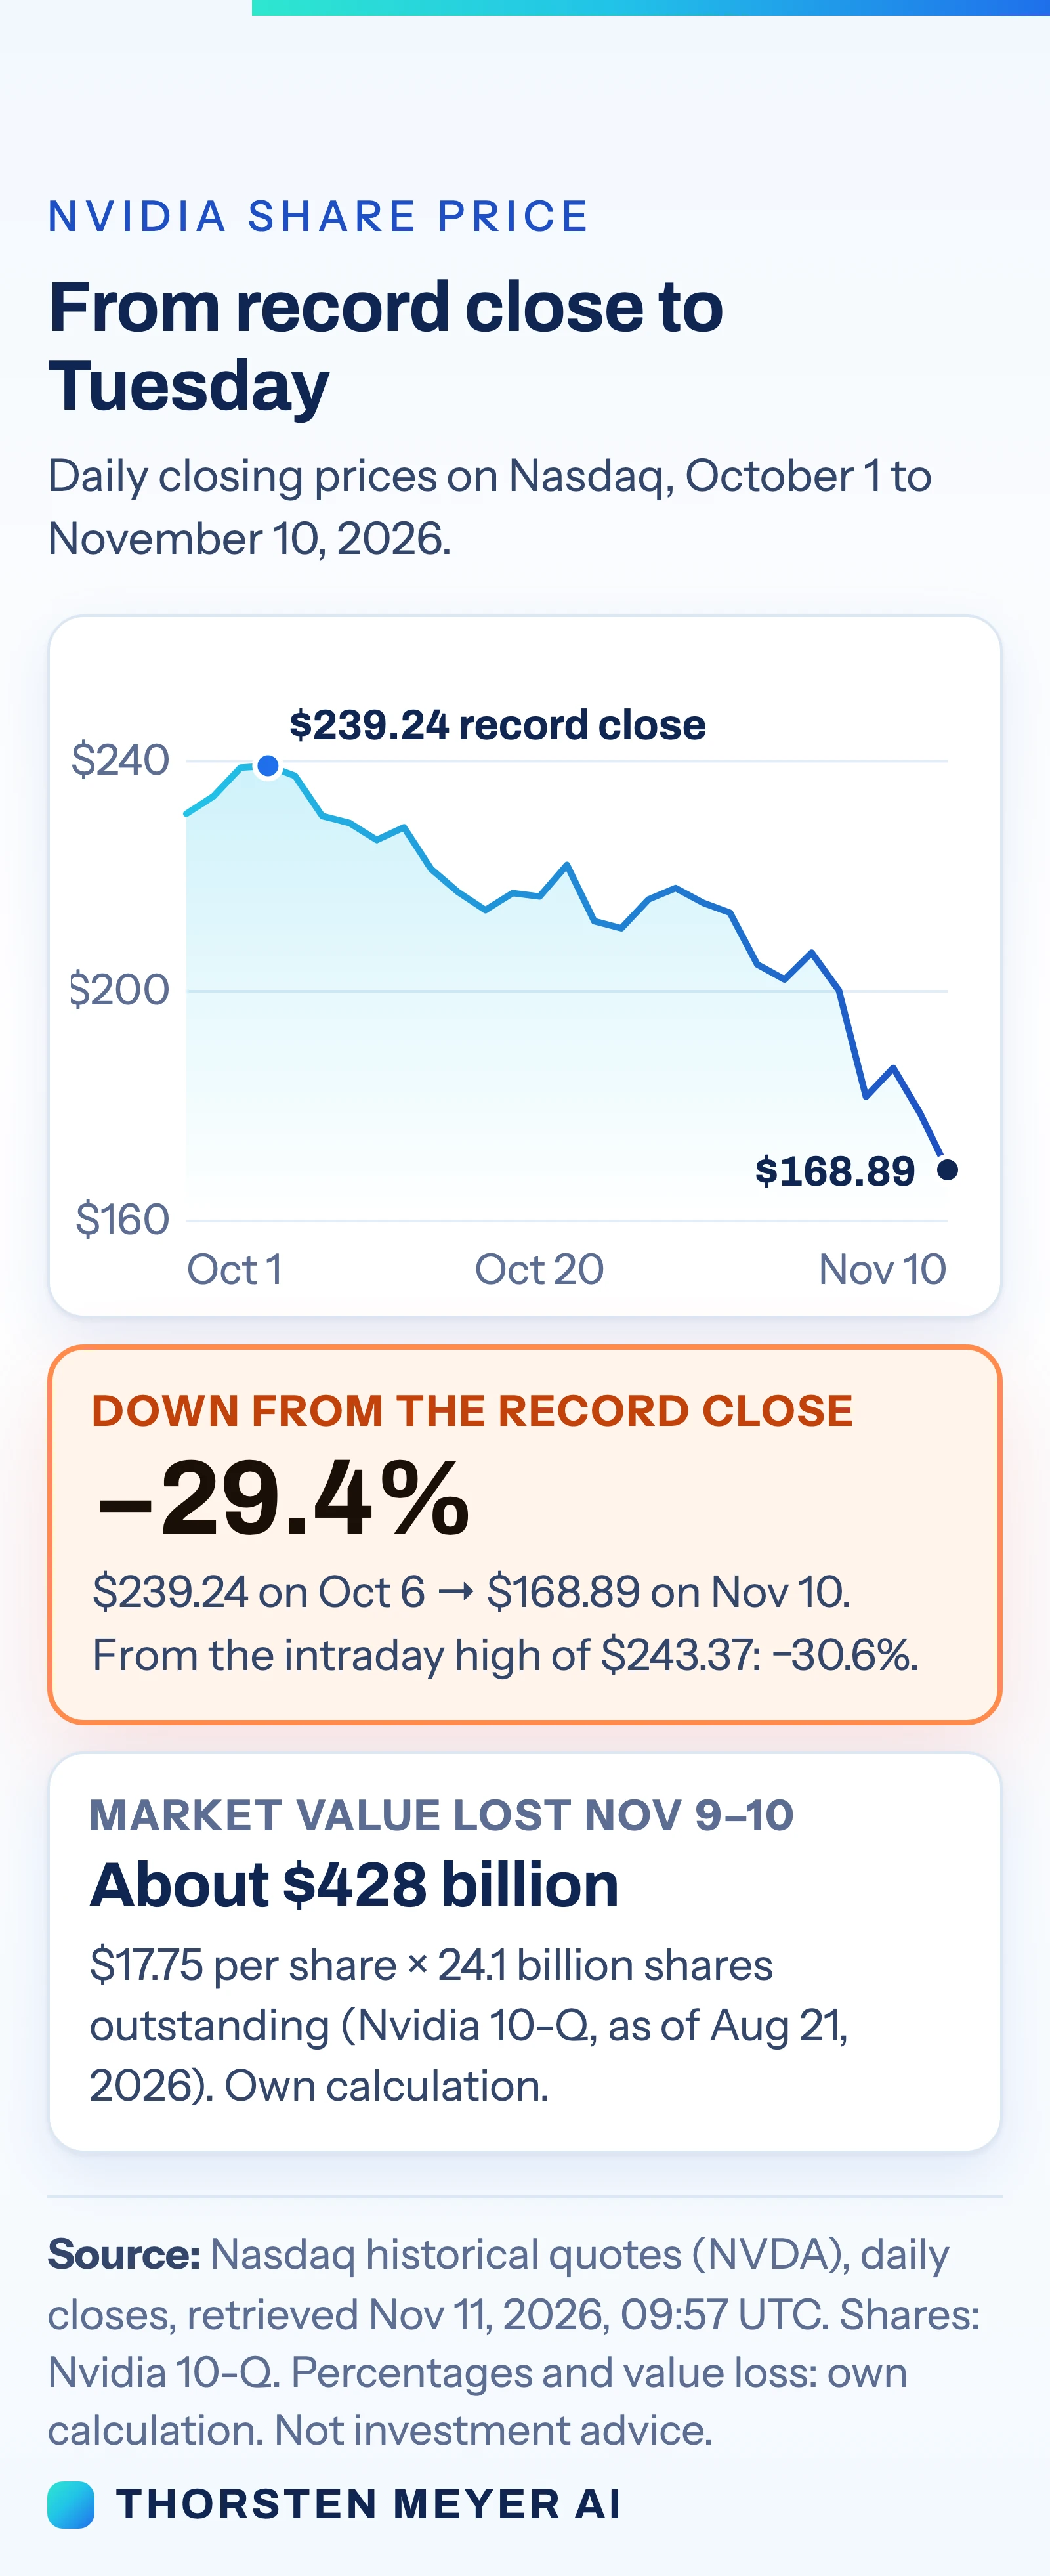
Nvidia shares closed at $168.89 on November 10, down from $186.64 two trading days earlier. Applying the price decline to the 24.1 billion shares Nvidia reported outstanding gives an estimated $428 billion reduction in market value; that is a calculation, not a reported cash loss. The stock was also 29.4% below its October 6 record closing price.
Nvidia shares closed at $168.89 on November 10, down from $186.64 at the November 6 close. Applying that $17.75 per-share decline to the 24.1 billion shares outstanding reported by Nvidia gives an estimated $428 billion reduction in market value over two trading days, according to calculations based on Nasdaq prices and the company’s filing. The drop adds to a longer slide that left the stock 29.4% below its October 6 record close.
The $428 billion figure is an estimate of the change in Nvidia’s stock-market value, not money withdrawn from the company. It is calculated by multiplying the change in closing share price by the share count Nvidia reported as of August 21. Share counts can change, and the calculation uses that reported figure for both dates. The prices and market-value estimates are through the November 10 close.
The retreat accelerated after November 4. Nvidia fell 9.26% on November 5, closing at $181.60, then rebounded 2.78% on November 6 to $186.64. It declined 4.27% on November 9 and another 5.47% on November 10. From its October 6 record close of $239.24, the stock had fallen 29.4%; measured against that day’s intraday high of $243.37, it was down 30.6%. Applying the same reported share count to the record-close difference produces an estimated $1.7 trillion decline in market value.
Reports point to pressure across technology stocks as well as Nvidia-specific developments. AFP linked sector selling to concern about a slower AI data-center buildout and reported that hotter-than-expected October inflation data raised expectations of Federal Reserve rate hikes. Separate coverage cited a board investigation announced November 8, a proposed shareholder class action filed November 9 and scrutiny of a customer over export controls. The available reporting does not establish how much any one factor contributed to the share-price decline.
Nvidia’s Weight in Major Indexes
Nvidia’s fall matters beyond the company’s investors because it makes up a substantial share of widely followed market indexes. As of November 9, the source material puts Nvidia at 6.64% of SPY, an S&P 500 tracker, and 7.10% of QQQ, a Nasdaq-100 tracker. CNBC reported that Nvidia’s decline weighed on all three major U.S. stock averages on November 10.
The selloff also illustrates how doubts about the pace and financing of AI infrastructure spending can affect a large technology company and broader benchmarks at the same time. Higher interest-rate expectations can add pressure to companies whose customers depend on large data-center investments. That is market context, not proof that any single concern caused Nvidia’s losses or that demand for its products has changed.
Products Worth Considering

Sonos Arc Ultra Soundbar with Dolby Atmos, Black

Logitech MX Ergo S Advanced Wireless Trackball Mouse USB-C – Graphite

Samsung Galaxy Tab A11+ 8GB RAM, 256GB Storage, Gray
As an affiliate, we earn on qualifying purchases.
From October Record to November Slide
Nvidia reached a record closing price of $239.24 on October 6. Yahoo Finance reported that the shares settled just below an intraday record that day and that the company’s intraday market value reached $5.84 trillion. The stock later fell 4.22% on October 30, then closed at $200.13 on November 4 before the sharp move on November 5.
The broader market was also under pressure. AFP attributed technology-sector selling to fears that the AI data-center buildout could slow after the U.S. midterm elections. The Motley Fool reported concerns that the incoming Congress could be less supportive of AI development and cited proposed data-center construction moratoriums by incoming governors. These are reported market concerns and political proposals; they do not establish a change in Nvidia’s sales or future orders.
On November 10, AFP said October inflation had slowed less than expected, lifting expectations for Federal Reserve rate hikes. CNBC reported that the consumer price index rose 0.4% in October, compared with economists’ 0.3% expectation, while the Nasdaq fell 0.7%. Reuters also cited uncertainty about the AI outlook. The reporting describes possible influences on trading, but does not quantify their individual effects on Nvidia.
““fears of a slower AI data centre buildout sparked heavy selling across the tech sector last week.””
— AFP, describing technology-sector trading
What the Price Drop Cannot Show
The $428 billion estimate depends on a share count reported on August 21 and the closing prices for November 6 and November 10. It does not measure a realized loss for every shareholder, and the source material does not provide an updated share count for each trading day. The longer-term $1.7 trillion estimate uses the same method and the October 6 record close as its comparison point.
It is also unclear how much of the selloff came from broader rate and AI-spending concerns, or from the reported investigation, lawsuit and customer scrutiny. The source material does not provide a company explanation tying those developments to the price move, nor does it establish any outcome from the investigation or lawsuit. As of the November 10 close, future demand, customer activity and the effect of export-control scrutiny remained unresolved.
November 17 Results in Focus
Nvidia is scheduled to report its third-quarter results on November 17. The report may give investors updated company figures and management commentary, but the source material does not specify what the company will say about the concerns raised in market coverage. The share-price figures in this article stop at the November 10 close; subsequent trading and any later developments are not covered.
Investors and market watchers will also be looking for further reporting on the board investigation, the proposed shareholder class action and the customer under export-control scrutiny. The information available here does not establish when those matters will be resolved or what their outcomes will be.
Key Questions
How was the estimated $428 billion market-value decline calculated?
The closing price fell $17.75 per share, from $186.64 on November 6 to $168.89 on November 10. Multiplying that change by Nvidia’s reported 24.1 billion shares outstanding gives an estimated $427.8 billion, rounded to about $428 billion.
Did Nvidia lose $428 billion in cash?
No. The figure estimates a decline in the company’s stock-market value based on share prices and a reported share count. It is not a measure of cash leaving Nvidia’s accounts.
How far was the stock below its October record?
At the November 10 close of $168.89, Nvidia was 29.4% below its October 6 record close of $239.24. Compared with the October 6 intraday high of $243.37, the decline was 30.6%.
What factors were reported as contributing to the decline?
Coverage cited market-wide concerns about AI data-center spending and interest rates, along with Nvidia-specific developments: a board investigation, a proposed shareholder class action and scrutiny of a customer over export controls. The available sources do not quantify how much each factor affected the stock.
When is Nvidia’s next quarterly report?
Nvidia is scheduled to report its third-quarter results on November 17, 2026.
Source: Thorsten Meyer AI